
Guides/Printing & delivery
Plot Different CTBs for Different Drawing Types in One Merged PDF
 Made with Dwg2Pdf
Updated September 19, 2026
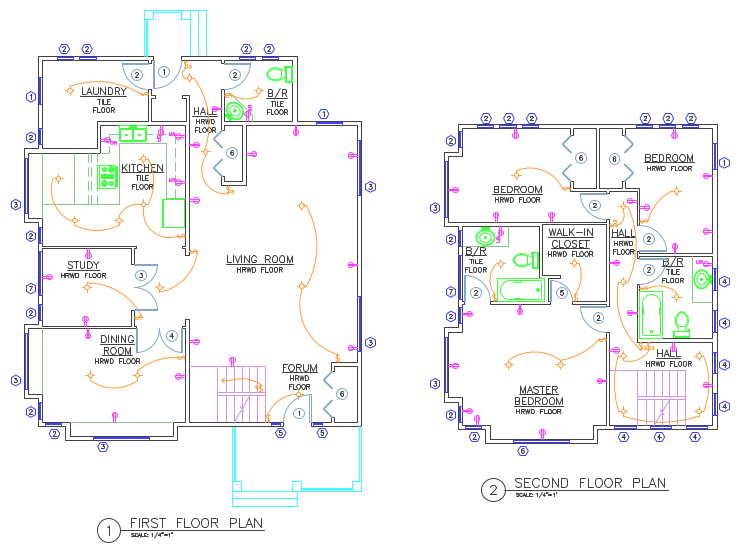
A submittal set is rarely plotted with one plot style throughout. A cover sheet or a schedule usually needs to come out flat black and white for legibility, while the product or system drawings behind it need to keep their layer colors — sometimes lightened with a screening CTB so color-coded systems stay readable without printing too dark.
AutoCAD's PUBLISH applies one plot style to the whole job, so mixing styles means either running PUBLISH once per style and merging the PDFs afterward in a separate tool, or babysitting the plot dialog file by file. Neither scales to a set that has to ship as a single, correctly ordered PDF on a deadline.
This guide uses Dwg2Pdf to assign a different CTB to each page position in the output and plot the whole set — cover sheet, schedule, product drawings, however many groups there are — into one merged PDF in a single run.
1. Order the layouts, then give each page its own CTB
Add Files… or Add Folder… to build the batch, then use the Layouts tab to check exactly which layouts go into the output — here, one Paper layout from each of two drawings. Top / Up / Down / Bottom set the order they'll appear in the merged PDF; the number next to each checked row (1, 2, …) is that layout's page position in the output, not just a sort order.
Set Merge Mode to Merge all files into one PDF, and Color Mode to Custom plot style (CTB).
Click Add CTB… once per plot style needed. For each one, leave Entire range unchecked and set the number field to the page position it should apply to — here, monochrome.ctb is mapped to page 1 (the cover-style D-size sheet) and Screening 50%.ctb to page 2 (the drawing that needs to keep its layer colors). Add a third CTB the same way for a third drawing type, and so on.
Click Plot. One merged PDF comes out, with each page carrying the plot style assigned to its position — no separate run per discipline, no merging PDFs afterward.
2. Page 1 comes out flat black and white
The layout mapped to page 1 plots with monochrome.ctb regardless of the colors used on screen — every layer, dimension and table line comes out solid black, which is what a schedule or a cover sheet needs for clean reproduction and scanning.
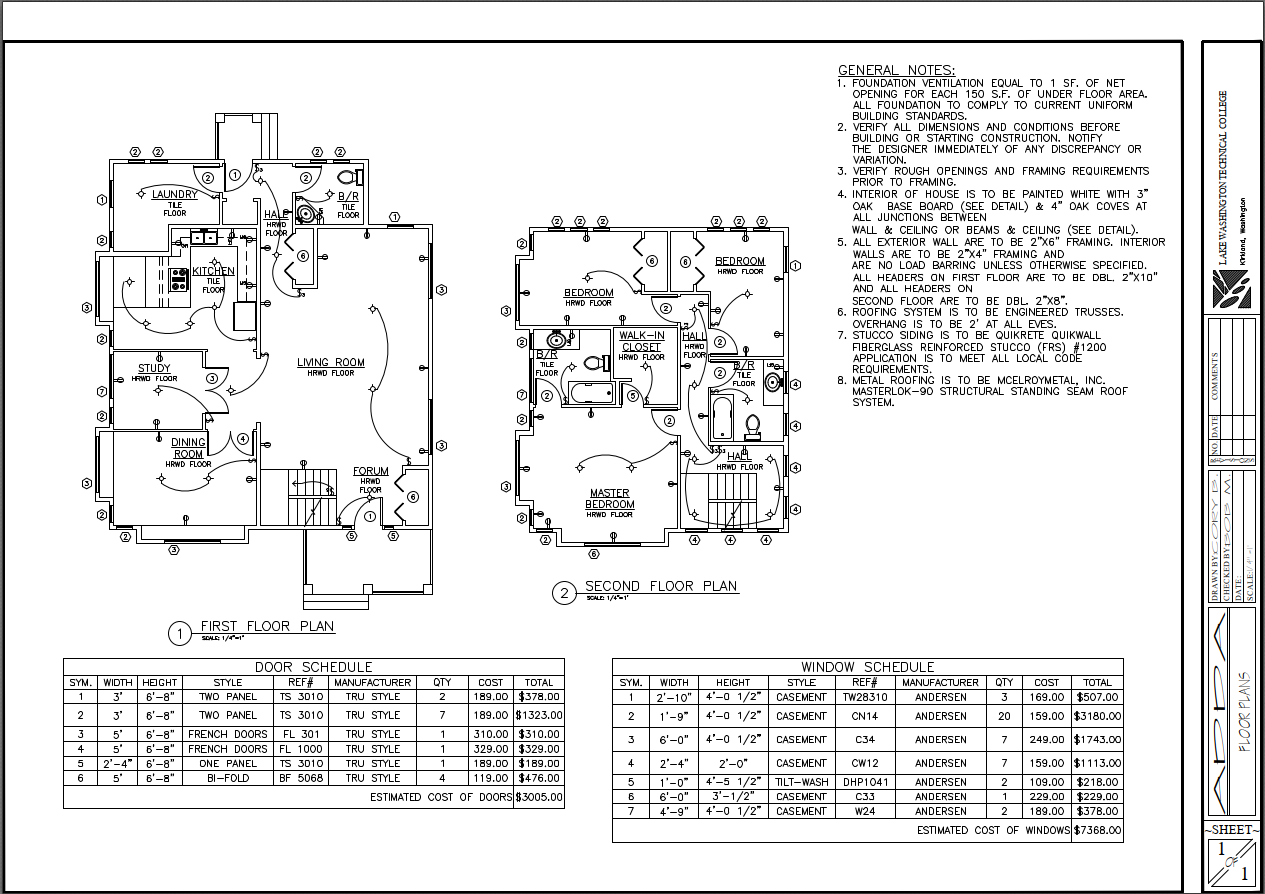
3. Page 2 keeps its layer colors, screened
The layout mapped to page 2 plots with Screening 50%.ctb instead — each layer keeps its own color, lightened by 50%, so color-coded systems (plumbing, electrical, framing) stay legible on the page without the saturated colors printing too heavy.
Both pages came out of the same Plot click, in the same merged PDF, in the order they were listed — the only difference between them is which CTB their page position was mapped to.
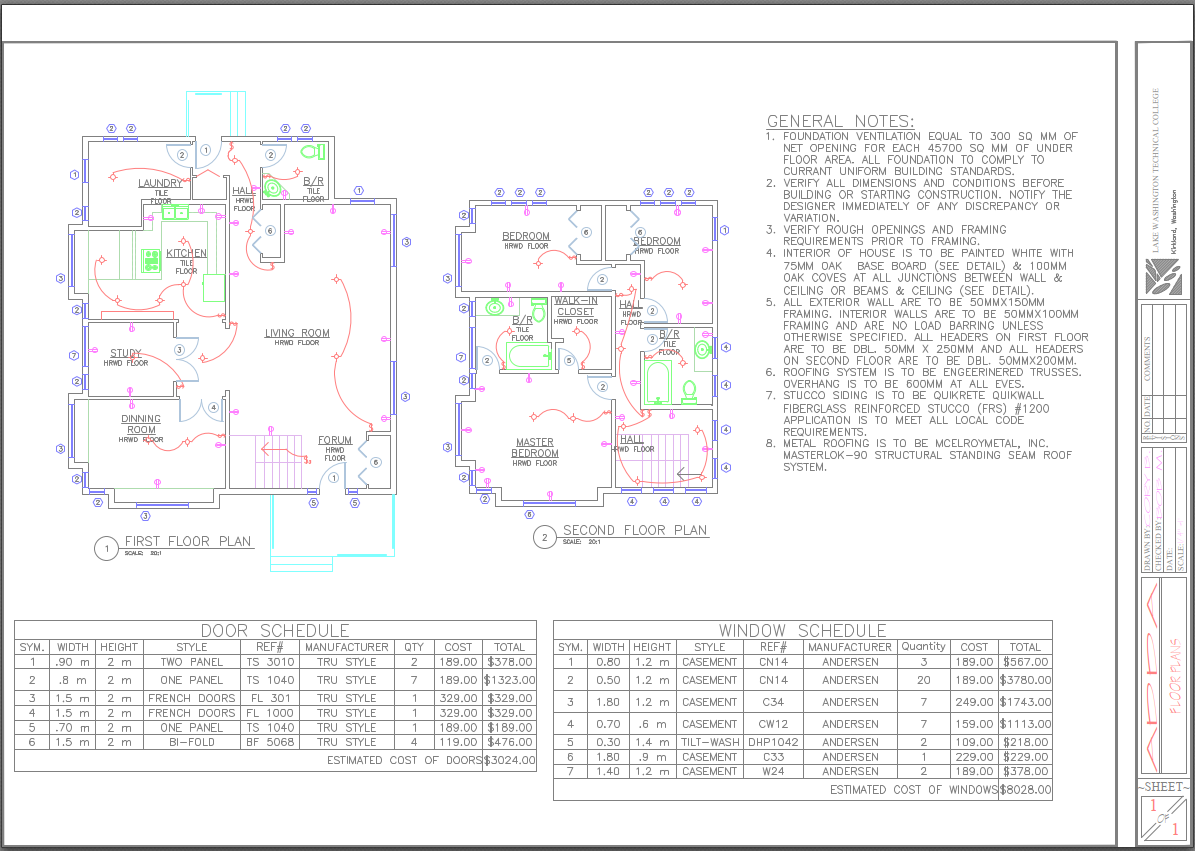
This scales to as many drawing types as a submittal set actually has — a cover/index in monochrome, a parts or equipment list in one CTB, and product drawings in another, all merged into one correctly ordered PDF from a single batch instead of one PUBLISH run per discipline.
For a full walkthrough of every screen and setting, see the Dwg2Pdf docs. To try it on your own drawings, download Dwg2Pdf — the Free tier covers up to 3 layouts per batch.